SkyMutt wrote:Florian wrote:At the same time, there is extension in the back of the arc that fully balances that consumption of lithosphere. Indeed, as we move further away from the arc (from position A to E), the velocity decreases which means that there is extension of surface. For example there is an extension of 15 mm/y (30-15=15 mm/y) between positions A and B.
See above. I'm still getting my head around the tectonics of the region (let alone your illustration) so feel free to explain how an extension rate of 15 mm/yr will balance a subduction rate of 30 mm/yr.
You're missing that extension is not occurring only between point A and B. I made another refinement of the illustration to show you that:
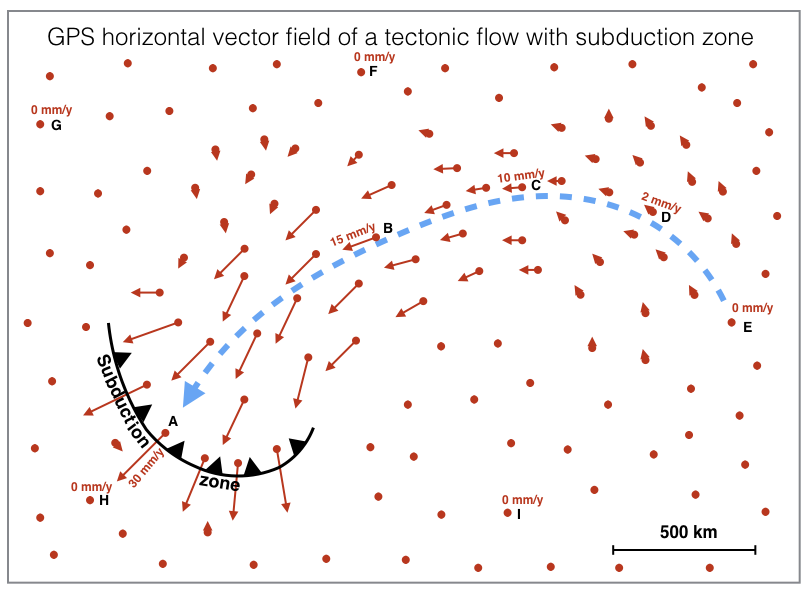
- GPS vector field of a tectonic flow.png (93.12 KiB) Viewed 2096 times
See, there is extension all along the flow line (blue dashed arrow). 15 mm/y between A and B, 5 mm/y between B and C, 8 mm/y between C and E and 2 mm/y between D and E. Total is 30 mm/y of extension along the flow line, balancing the rate of consumption at the subduction zone.
It is quite logical given that E and H are motionless relative to each other.
So do you agree now that there is a subduction rate of 30 mm/y, yet no gross reduction of surface of the region?
What happens in the back arc is the most important. My experience with people, including geophysicists (!), is that this very simple principle is really hard to understand. I don't know really why...
SkyMutt wrote:Assuming I'm misunderstanding something as noted above, say for the sake of discussion that in the illustration you created that is the case. What we see in the figure is not an overall motionless region with a particular area of movement. Dragging that forward:

Rather we see the whole region north and northeast of the Hellenic trench in movement. Is there a real-world region that fits your illustration?
In the real world, there is always some motion of the lithosphere, especially depending on the reference frame. That's why I initially represented "chaotic vectors".
If you observe carefully the figure of the paper, you'll see that the motions around the area in movement are negligible (vector length is almost null): In Greece/Eurasia, in Africa (Lybia/Egypt), Israel/lebanon, and in the Causase (East of the black Sea).
So, that real world situation is darned close to my simplified illustration.
There is no surface reduction in the region, yet there is a very active tectonic flow that is heading toward the Mediterranean Sea, subducting lithosphere on its way there.
Here is an additional figure of the region (real world).
- GPSagean.gif (275.18 KiB) Viewed 2096 times
Again, the dashed area is relatively motionless, and the tectonic flow is correlated to a large uplift in the East-Anatolian region.
Note that I did not invent this flow stuff. Emile Argand, a renowned Swiss geologist described it in its famous book "La tectonique de l'Asie" (Asian Tectonics) almost a century ago (full book in pdf click
HERE).
He identified many flow lines in Eurasia and called them "Virgation".
Here is a figure extracted from Argand's book (p333) illustrating a virgation.

- Argand-Virgation.png (69.91 KiB) Viewed 2096 times
The flow in the Aegean region is a virgation in Argand's terminology.
If you understand this concept, you may be over the tipping point, and we can move to a similar case in another area of the world (the treasure is found at the end of the journey).
In the field of observation, chance favors only the prepared mind. Louis Pasteur.

")

")

")
")

")

")


")