Posted: Apr 04, 2017 8:31 pm
I was playing with desmos again and generated this graph:
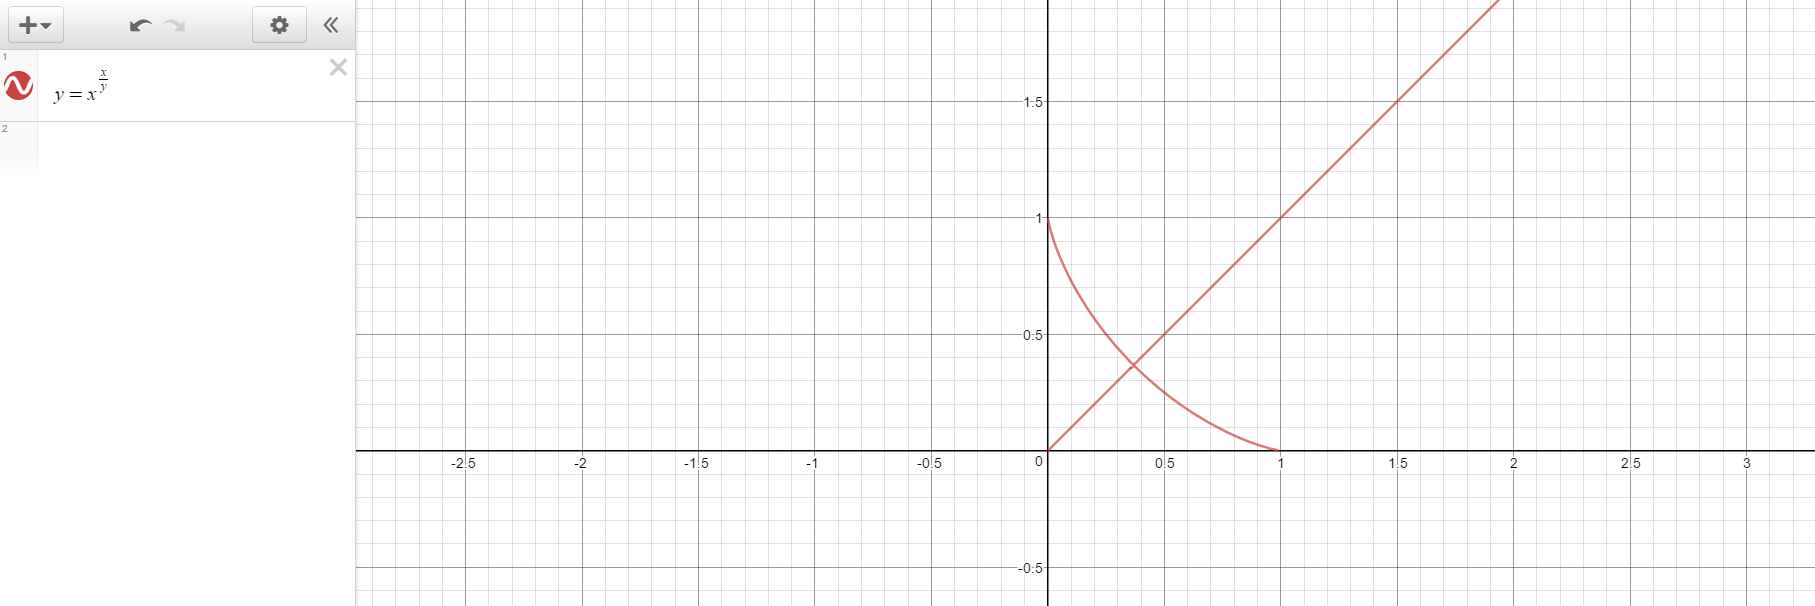
Now, it in itself is an interesting graph, a Y=X line AND a curve which at first glance seems to pass through 1,0 and 0,1 however some more investigation reveals yet more intrigue.
The curve does pass through 0,1 as you get 1^0 and anything to the power of 0 is 1, however it can't pass through 1,0 as it either results in y being undefined or infinity, either way that means y is and isn't 0, so can't exist when x is 1.
Now, plotting it with x having some coefficients makes an even more interesting little effect...
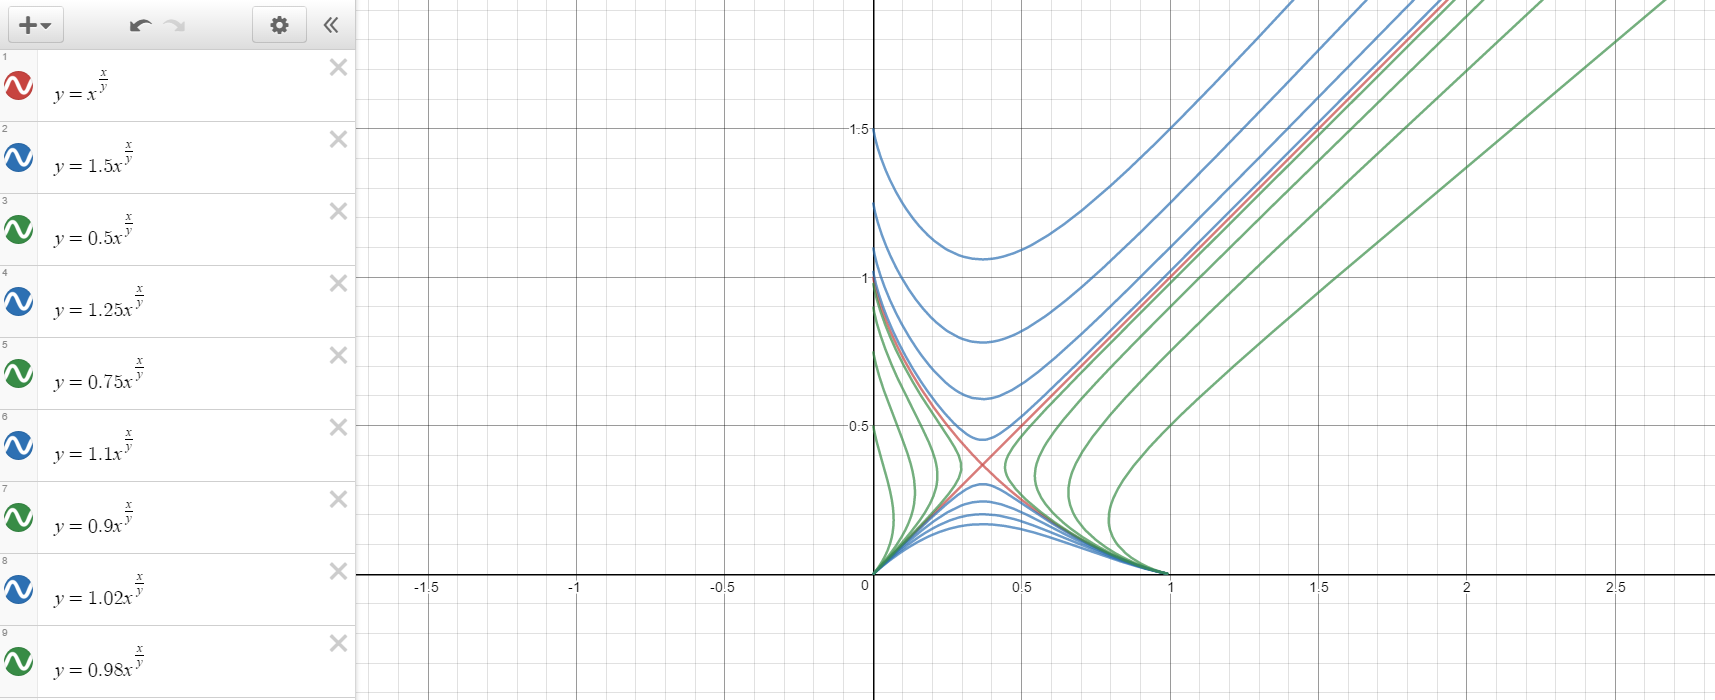
Coefficients of x < 1 make 2 curves with a vertical split (aka two curves next to eachother but curving away from eachother), and when coefficient x > 1 there is a horizontal split (aka two curves ontop of eachother curving away from eachother)...
The fact it doesn't just begin to intersect in two points, but rather reverses where the split is, is in itself interesting...However it raises a question, what is actually happening when coefficient of x = 1?
Is it a graph with two right angles on its line? What exactly is this point of the right angles/intersection? Is it not a right angle, but the straight line is one line and the curve is another? Does it ever actually intersect, or is there an infinitely small space for an asymptote there?
Also, what exactly is the lowest y value of the graph and does the graph touch the origin? (I imagine the same error should occur with undefined from dividing by zero?)
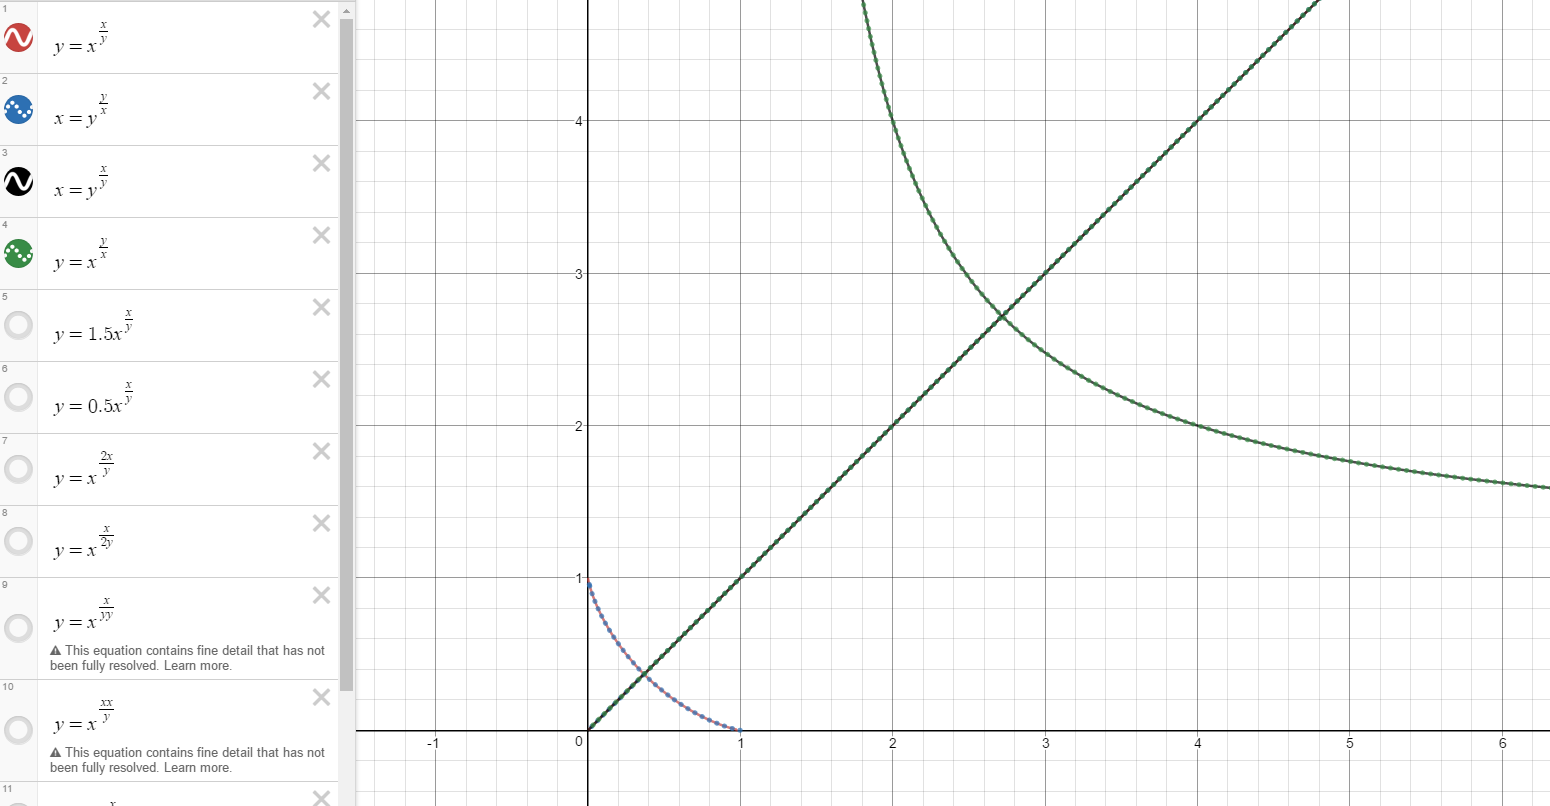
EDIT: Weirder yet, flip the fraction (or the main X & Y terms) and you get an enlarged version of the graph.
Now, it in itself is an interesting graph, a Y=X line AND a curve which at first glance seems to pass through 1,0 and 0,1 however some more investigation reveals yet more intrigue.
The curve does pass through 0,1 as you get 1^0 and anything to the power of 0 is 1, however it can't pass through 1,0 as it either results in y being undefined or infinity, either way that means y is and isn't 0, so can't exist when x is 1.
Now, plotting it with x having some coefficients makes an even more interesting little effect...
Coefficients of x < 1 make 2 curves with a vertical split (aka two curves next to eachother but curving away from eachother), and when coefficient x > 1 there is a horizontal split (aka two curves ontop of eachother curving away from eachother)...
The fact it doesn't just begin to intersect in two points, but rather reverses where the split is, is in itself interesting...However it raises a question, what is actually happening when coefficient of x = 1?
Is it a graph with two right angles on its line? What exactly is this point of the right angles/intersection? Is it not a right angle, but the straight line is one line and the curve is another? Does it ever actually intersect, or is there an infinitely small space for an asymptote there?
Also, what exactly is the lowest y value of the graph and does the graph touch the origin? (I imagine the same error should occur with undefined from dividing by zero?)
EDIT: Weirder yet, flip the fraction (or the main X & Y terms) and you get an enlarged version of the graph.